I was wondering how fast the Taylor Series for $\exp(\pi i)$ would converge. According to Taylor,
$$\exp(\pi i) = 1 + (\pi i) + (\pi i)^2/2! + (\pi i)^3/3! + (\pi i)^4/4! + \ldots = \sum_{j=0}^\infty \frac{(\pi i)^j}{j!}.$$
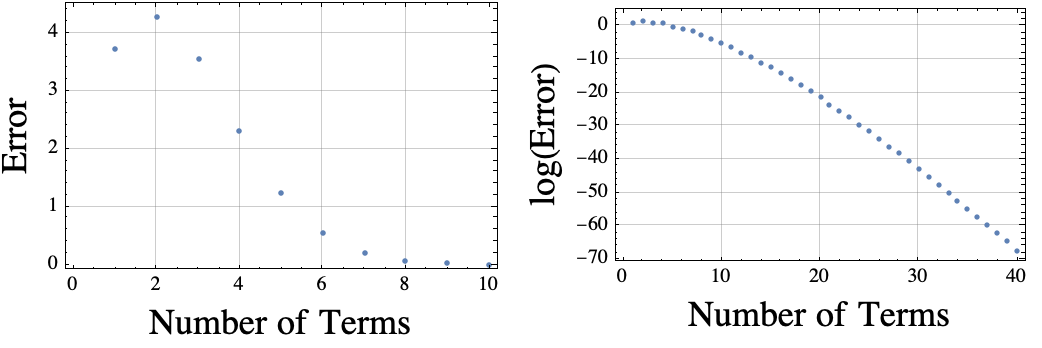
According to Euler, $\exp(\pi i)= -1$. I wanted to estimate the convergence rate, so I just fired up Mathematica and plotted the values of $$error(k) = \left| 1+ \sum_{j=0}^k \frac{(\pi i)^j}{j!}\right|.$$ The Mathematica plot is shown below.
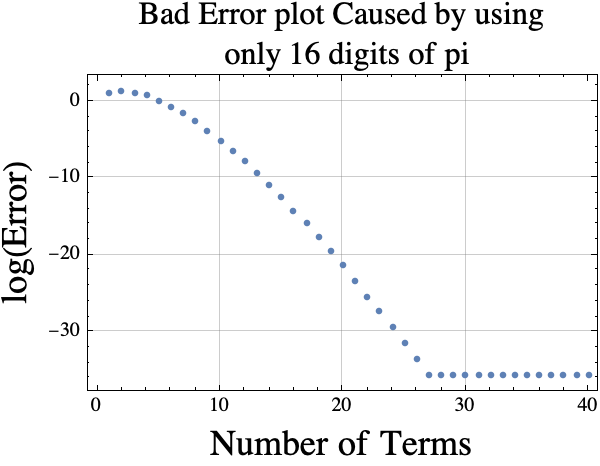
It occurred to me that Mathematica knows thousands of digits of pi. I could force it to only use the first 16 digits by using double precision floating point numbers. If I do that, then the log(Error) plot is “wrong” because the approximation for pi is not accurate enough. The erroneous plot is shown below.
If you want a good estimate of the truncated Taylor series error using $k$ terms, you could use the absolute value of term $k+1$ which is
$$error(k)\approx f(k)= \frac{\pi^{k+1}}{(k+1)!}$$.
Here is a plot of $r(k)= error(k)/f(k)$. If the estimator is good, then the $r(k)$ values (y-coordinates) should be near 1.

Creating these plots requires around 30 digits of pi! If I wanted to look at more terms, I would need more digits of pi.
Here is the code I used to generate the plots.
SetOptions[ListPlot, GridLines -> Automatic, Frame -> True, ImageSize -> 250];
error[k_] := Abs[ 1 + Sum[ (I Pi)^j/j!, {j, 0, k}]];
plt0 = ListPlot[ Array[error, 10], Frame -> True,
 FrameLabel -> (Style[#, 18] & /@ {"Number of Terms", "Error"})];
plt1 = ListPlot[Log[ Array[error, 40]],
 FrameLabel -> (Style[#, 18] & /@ {"Number of Terms",
 "log(Error)"})];
error[k_] := Abs[ 1 + Sum[ (I N[Pi])^j/j!, {j, 0, k}]];
plt3 = ListPlot[Log[ Array[error, 40]], Frame -> True,
 FrameLabel -> (Style[#, 18] & /@ {"Number of Terms", "log(Error)",
 "Bad Error plot Caused by using only 16 digits of pi", " "}),
 PlotLabel ->
 Style["Bad Error plot Caused by using\n only 16 digits of pi",
 16]];
errorRat[k_] :=
 Abs[ 1 + Sum[ (I Pi)^j/j!, {j, 0, k}]]/ (Pi^(k + 1)/(k + 1)! );
plt4 = ListPlot[Array[errorRat, 40], Frame -> True,
 FrameLabel -> (Style[#, 18] & /@ {"Number of Terms",
 "error(k)/f(k)"}),
 PlotLabel ->
 Style["Plot error(k) divided by estimated\n error(k) for \
k=1,2,..., 40", 16]];