Information Theory

You are currently browsing the archive for the Information Theory category.

The Data Processing Inequality is a nice, intuitive inequality about Mutual Information.  Suppose X,Y, Z are random variables and Z is independent of X given Y, then 

MI(X,Z) <= MI(X,Y).

See http://www.scholarpedia.org/article/Mutual_information which has an easy one line proof.

We can apply this inequality to a stacked restricted Boltzmann machine (a type of deep neural net).

Let X be a random binary vector consisting of the states of neurons in the first layer.

Let Y be a random binary vector consisting of the states of neurons in the second layer.

And let Z be a random binary vector consisting of the states of neurons in the third layer.

Then

MI(X,Z) <= min( MI(X,Y), MI(Y,Z) ).

Informally, that inequality says that amount of information that can flow from the first layer to the third layer of a stacked RBM deep neural net is less than or equal to the maximum flow rate between the first and second layer.  Also, the amount of information that can flow from the first layer to the third layer is less than or equal to the maximum flow rate between the second and third layer.  This inequality will seem obvious to those who know information theory, but I still think it’s cute.

The above inequality is also sharp in the sense that there are simple examples where the right hand side equals the left hand side.  Consider a Markov Random Field consisting of just three random binary variables X, Y and Z.  Suppose further,  that P(X)=0.5, P(X=Y)=1,  and P(Y=Z)=1.  Then MI(X,Y)=1 bit, MI(Y,Z) =1 bit, and MI(X,Z) =1 bit so both sides of the inequality are 1.

Information theory can also be used to construct a lower bound on the information transfer between the first and third layer.

MI(X,Z) >= MI(Y,X)+MI(Y,Z) – H(Y)

where H(Y) is the entropy of Y (i.e. the information content of the random variable Y).

mi3nn

Intuitively, if the sum of the information from X to Y and from Z to Y  exceeds the information capacity of Y, then there must be some information transfer between X and Z.

So, I noticed Brian Rushton’s question on matheducators.stackexchange.com. He asked,

“What should be included in a freshman ‘Mathematics for computer programmers’ course?”

User dtldarek had a pretty cool reply broken up into three parts:

  • Math that is actually useful.
  • Math that you can run into, and is generally good to know.
  • Math that lets you build more awesome math.

His answer got me to think about and revise my “100 Most useful Theorems and Ideas in Mathematics” post.  I wondered which of the 100 I used every week. Rather than trying to think about every week, I just thought it would be interesting to identify which ideas and theorems I used this week excluding the class I am teaching.

The first several ideas on the top 100 list, you can’t seem to avoid:  counting, zero, decimal notation, addition, subtraction, fractions, and negative numbers. Everyone uses these ideas when they buy anything or check their change.  (I wonder how many people rarely count the change from the cashier.)

The next group was mostly about algebra:  equality, substitution, variables, equations, distributive property, polynomials, and associativity.  Every week I attend two math seminars (Tensor Networks and Approximation Theory), so I use these ideas every week, just to add to the discussion during the seminar.

Strangely, I can’t remember using scientific notation this week except while teaching.  During class, I briefly mentioned the dinosaur killing asteroid (see the Chicxulub crater).  It’s hard to calculate any quantity about the asteroid (energy = 4 ×1023 Joules, mass = 2 ×1015 kg ?,  velocity $\approx$ 20000 meters/sec) without using scientific notation.  But, other than during class, I don’t remember using scientific notation.

During the Approximation Theory Seminar, we discussed polynomial approximations to the absolute value function so we used polynomials, infinity, limits, irrational numbers (square roots), the idea of a function, inequalities, basic set theory, vector spaces esp. Hilbert/Banach Spaces, continuity, Karush–Kuhn–Tucker conditions, linear regression, the triangle inequality, linearity, and symmetry during our discussion.  That seems like a lot, but when you have been using these ideas for decades, they are just part of your vocabulary.

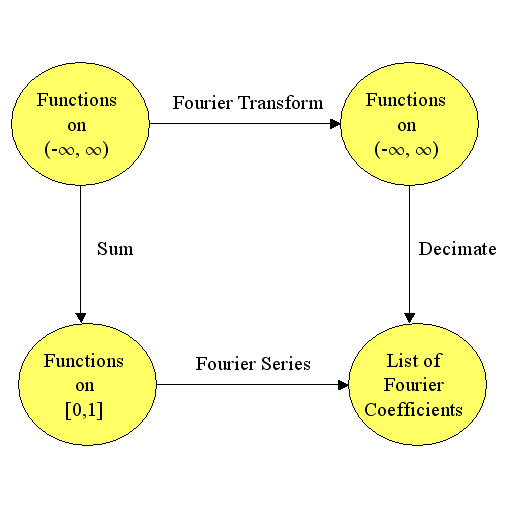
So between the approximation theory seminar and daily restaurant mathematics, I used most of the first 40 items from the top 100 list.   Earlier in the week, I wrote up a simple category theory proof about isomorphisms and pull-backs.  Turns out, if you pullback an isomorphism and another arrow, then you get another isomorphism.  For example, in the commutative diagram below the top arrow and the bottom arrow are both isomorphisms (isometries even) and the entire diagram is a pullback.  If the bottom arrow is an isomorphism and the entire diagram is a pullback, then the top arrow is an isomorphism.  (The reverse is not true.)


FourCom


Working on the proof got me thinking about trig functions, modular arithmetic, injective/surjective functions, Fourier transforms, duality, eigenvalues, metric spaces, projections, the Reiz Representation Theorem, Plancherel’s theorem, and numerical integration.

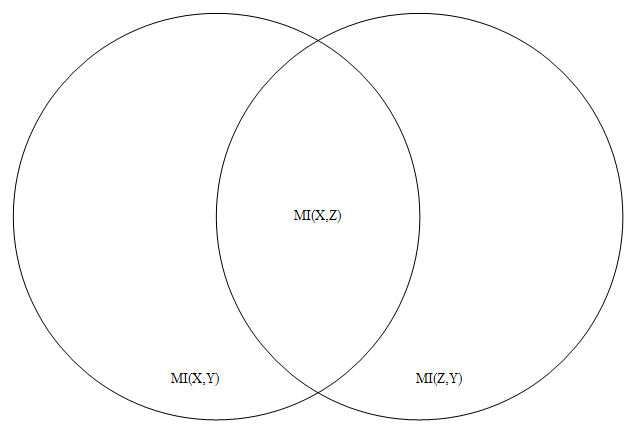
Probability and information theory were largely missing from my week until I stopped by Carl’s house yesterday. He and I got into a discussion about category theory, information theory, and neural networks.  One thing we noticed was that 1-1 functions are the only functions that conserve the entropy of categorical variables. For example, if $X\in\{1,2,3,4,5,6\}$ is a die roll, then $Y=f(X)$ has the same entropy as $X$ only if $f$ is 1-1.  Turns out you can characterize many concepts from Category theory using entropy and information theory.  So we used random variables, probability distributions, histograms, the mean (entropy is the mean value of the log of the probability), standard deviations, the Pythagorean theorem, statistical independence, real numbers, correlation, the central limit theorem, Gaussian Distributions (the number e), integrals, chain rule, spheres, logarithms, matrices, conic sections (the log of the Gaussian is a paraboloid), Jacobians, Bayes Theorem, and compactness.

I almost avoided using the Pigeon Hole Principle, but then Carl argued that we could use the definition of average value to prove Pigeon Hole Principle.  I still don’t feel like I used it, but it did come up in a discussion.

Notably missing from my week were (surprisingly): derivatives, volume formulas (volume of a sphere or cube), Taylor’s theorem, the fundamental theorem of calculus, and about half of the ideas between #63 Boolean algebra and #99 uncountable infinity.

So, it looks like I typically use around 70 ideas from the list each week—more than I thought.


I will probably get back to 2048 stuff later this month and maybe a post on Fourier Transforms.


Have a great day!    – Hein


Reddit has this pretty cool subreddit ELI5 = “Explain like I’m 5″ where people try to explain topics as if they are talking to a five year old.  It’s an interesting exercise to see how much of a difficult topic like nuclear energy or solar physics you could explain to a five year old.  Here is my attempt to explain Entropy and Mutual Information to a bright five year old that isn’t afraid of big words or long sentences.

(This post is going to be amazingly long and very simplistic, so I suggest you don’t bother reading it unless you think it might be fun to consider how to explain a complex concept like mutual information to a five year old.)


Random Variables

In order to explain (information theoretic) entropy we need to talk about random variables.  A random variable is a number that you get from a repeatable experiment.  For example, if you roll a die, the outcome is 1, 2, 3, 4, 5, or 6.  We say that the result of each die roll is a random variable.


Entropy

So random variables have something called entropy.  In order to talk about entropy it’s helpful to first talk about the doubling numbers.  The doubling numbers are 1, 2, 4, 8, 16, ….  I call them doubling numbers because 1+1 = 2, 2+2 =4, 4+4 =8, and so on.  (The official name of doubling numbers is “the powers of two” but let’s just call them doubling numbers for now.)


BITS

If a random variable has two equally likely outcomes, we say that the variable has an entropy of 1 bit.  If it has four equally likely outcomes, then the variable has 2 bits, eight 3 bits, and 16 outcomes gives 4 bits.  Of course, some random variables have like 6 outcomes and that is not a doubling number, so we could say that it has about two and a half bits because 6 outcomes is half way between 4 outcomes which is 2 bits and 8 outcomes which is 3 bits.

How did we get the name bits?  Well, in a computer bits are little electronic parts that are either on or off.  We use the code 0 for off and 1 for on.  (This code is called the binary code.)  We could represent the result of an experiment (a random variable) with these bits.  Suppose that our experiment is flipping a coin and we call tails 1 and heads 0.  Then we would need one bit to record the results of each coin flip.


Three bits for an eight sided DIE

The number of bits needed to record the roll of an eight sided die would be larger. It can be done with three bits as follows.   If you roll a 1, set the bits to off-off-on (001).  If you roll a two, set the bits to 010.  A 3 set them to 011, 4 ->  100, 5 -> 101, 6 -> 110, 7 -> 111, and 8 -> 000.  Notice that we were able to represent every possible outcome with only 3 bits.  That’s why we say the entropy of an eight sided die roll is three bits.


A multi-stage experiment

More complicated experiments would require some more difficult computations. Sometimes, the outcomes are not all equally likely.  Suppose our experiment has two stages.  In stage one we flip a nickel.  If the result is tails, we quit.  If the result is heads, we flip a quarter.  There are three possible results for this experiment:

  1. The nickel is tails
  2. The nickel is heads and the quarter is tails.
  3. The nickel is heads and the quarter is heads.

The nickel is tails about half the time and heads half the time.  So we only have to record the quarter half of the time.  The average number of bits needed to record this experiment is one and a half.  One bit for the nickel and one half bit for the quarter because we only need to write down the quarter flip outcome (1 bit) half of the time.


MUTUAL INFORMATiON

Sometimes random variables share bits.  When that happens, we say that they have mutual information. Most random variables do not share information. In that case, we say the variables are independent and the mutual information (shared information) is zero.


A COMPLICATED EXAMPLE

Suppose that Harry and Sally are doing an experiment.  They flip a penny, a nickel, a dime, and a quarter.  After the experiment, Harry writes down the results of the penny flip and the nickel flip.  Sally writes down the results of the nickel, the dime, and the quarter.  There are four possible outcomes for Harry: Head-Head, Head-Tail, Tail-Head, and Tail-Tail.  We say that Harry’s recording uses 2 bits, so his entropy is 2 bits.  Sally could have 8 different results, but she would only need 3 bits, one for each coin, to record her results, so her entropy is 3 bits.  The mutual information between Harry and Sally is the nickel flip which is just 1 bit (1 for heads, 0 for tails).  The overall entropy of Harry and Sally together is 4 bits because there are four coins.  The Joint entropy of Harry and Sally together is the number of bits needed to record both Harry’s result and Sally’s result.  Harry uses 2 bits and Sally 3 bits, but only 4 bits are needed because the nickel is shared.


THE FORMULA

There is a general formula for the mutual information between Harry and Sally.

Mutual Information = Harry’s Entropy + Sally’s Entropy – The Joint Entropy.

For this experiment the mutual information is  2 + 3 – 4  which is 1 bit.


 End Note

Well, that’s it.  Maybe I gave an explanation appropriate for twelve year olds. Maybe not.  I had my eighth grade son read it and then I gave him a 6 question quiz. After I corrected two of his answers, he was able to calculate the mutual information of two, fairly simple random variables.


I have been wanting to write a post about using mutual information for feature selection, but I know that a few readers do not know information theory.  Some of my executive friends have forgotten all of their calculus, so I will probably first write a short executive introduction to information theory next week or find an appropriate introduction on the internet.  Earlier today while I was looking for a very basic introduction, I ran across the 111 page “Basic Concepts in Information Theory” by Marc Uro and the 3 page blog post “A Short, Simple Introduction to Information Theory” by Ryan Moulton which are both appropriate for undergraduate sophomores.

Marc’s book is great.  It covers all of the basic information theory ideas like entropy, cross-entropy, mutual information, linear codes, compression, and Shannon capacity.  Most of his explanations use only basic probability with a little summation notation and a matrix or two.  (His notation is carefully crafted, but sometimes a bit non-standard).  He avoids using calculus, so this book can be read by a bright freshman.

Ryan’s two page web post uses a little probability, logarithms, and summation notation but nothing else.

So I was thinking about how I should estimate the KL distance between two mixtures of Gaussians.  For discussion purposes, assume that the first mixture has pdf $f(x)$ and the second has pdf $g(x)$.

My fist thought was to randomly generate samples from $f(x)$ and to compute the average value of $\log(g(x))$ from the other mixture.  That would give me $E_f[\log(g(X))] = -H(f,g)$  and  $KL(f,g) = H(f,g) – H(f)$ where $H(f,g)$ is the cross entropy and $H(f)$ is the entropy.  This converges at order $1/\sqrt{n}$ and it is easy to program.

My second thought was to borrow an idea from Unscented Kalman filters.  I thought about creating a non-random sampling of from one distribution at specific points and estimating $E_f[\log(g(X))]$ from those points.

My third thought was to try Google.  Google suggested “Lower and Upper Bounds for Approximation of the Kullback-Leibler Divergence Between Gaussian Mixture Models” by Durrien, Thiran, and Kelly (2012) and “Approximating the Kullback Leibler divergence between Gaussian Mixture Models” by Hershey and Olsen (2007).  Here are some notes from their papers:

1.  The KL distance between two Gaussians $f$ and $g$ is

$D_{KL}( f || g ) = {1\over2}\left( \log\left( { \det(\Sigma_g)}\over { \det(\Sigma_f)}\right) + Tr( \Sigma_g^{-1}  \Sigma_f)  + ||\mu_f – \mu_g||_g^2 -d \right)$ where $d$ is the dimension of the space, $\Sigma$ is the covariance matrix, $\mu$ is the mean, $Tr$ is the trace, and

$|| x ||^2_g = x^T (\Sigma_g^{-1}) x$.

2.   Hershey and Olsen review several methods for estimating the divergence:

  • Monte-Carlo methods,  
  • Unscented methods (unscented methods are simple and an unscented approximation of $\int f(x) g(x) dx$ is exact if $f$ is a Gaussian and $g$ is quadratic),
  • Gaussian Approximation (this is bad, don’t do it, if you do do it, “I told you so”),
  • Product of Gaussian approximations using Jensen’s inequality (this is cute, I like it, but I’m not sure how accurate it is), and
  • Match Bound approximation by Do (2003) and Goldberg et al (2003) (just match each Gaussian with another Gaussian in the other mixture and compute those KL distances).

3.  Hershey and Olsen introduce a delightful improvement over Match Bound approximation using variational methods.  They have the same idea as Match Bound, but they significantly reduce the error in Jensen’s inequality by introducing weighted averages.  Since Jensen’s inequality produces a lower bound using the weighted average, they maximize the lower bound under all possible weightings. The maximizer happens to have a very simple form, so the bound is also is very simple to compute.  Very nice.  (Numerical results are given at the end of the paper.)  I’ve got to try this one out.

4.  Durrien, Thiran, and Kelly improve on the Hershey and Olsen method, but I’m not sure how much better the new method is.  More research required.

In “Autoencoders, MDL, and Helmholtz Free Energy“, Hinton and Zemel (2001) use Minimum Description Length as an objective function for formulating generative and recognition weights for an autoencoding neural net.  They develop a stochastic Vector Quantization method very similar to mixture of Gaussians where each input vector is encoded with

$$E_i = – \log \pi_i  – k \log t + {k\over2} \log 2 \pi \sigma^2 + {{d^2} \over{2\sigma^2}}$$

nats (1 nat = 1/log(2) bits = 1.44 bits) where $t$ is the quantization width, $d$ is the Mahalanobis distance to the mean of the Gaussian, $k$ is the dimension of the input space, $\pi_i$ is the weight of the $i$th Gaussian.  They call this the “energy” of the code.  Encoding only using this scheme wastes bits because, for example, there may be vectors that are equally distant from two Gaussian. The amount wasted is

$$H = -\sum p_i \log p_i$$

where $p_i$ the probability that the code will be assigned to the $i$th Gaussian. So the “true” expected description length is

$$F = \sum_i p_i E_i – H$$

which “has exactly the form of the Helmholtz free energy.”  This free energy is minimized by setting

$$p_i = {{e^{-E_i}}\over{\sum_j e^{-E_j}}}.$$

In order to make computation practical, they recommend using a suboptimal distributions “as a Lyapunov function for learning” (see Neal and Hinton 1993). They apply their method to learn factorial codes.


In the short, well written paper “An Estimate of an Upper Bound for the Entropy of English“, Brown, Stephan Della Pietra, Mercer, Vincent Della Pietra, and Lai (1992) give an estimated upper bound for English of 1.75 bits per character.  That estimate was somewhat lower than Shannon’s original upper bound of 2.3 bits per character. Along the way they give nice simple explanations of entropy and cross-entropy as applied to text.  More recently Montemurro and Zanette (2011) showed the entropy of all languages is around 3.5 bits per word. (see Wired Article and Plos One)

I really enjoyed Jeremy Kun’s article on Information Distance at Math ∩ Programming.

The blog Computational Information Geometry Wonderland pointed me toward the article “k-MLE: A fast algorithm for learning statistical mixture models” by Frank Nielsen (2012).  $k$-means can be viewed as alternating between 1) assigning points to clusters and 2) performing a maximum likelihood estimation (MLE) of the mean of spherical Gaussians clusters (all of which are forced to have the same covariance matrix equal to a scalar multiple of the identity).  If we replace the spherical Gaussian with another set of distributions, we get $k$-MLE.  Nielsen does a remarkably good job of introducing the reader to some complex concepts without requiring anything other than a background in probability and advance calculus.  He explores the relationships between $k$-MLE with exponential families and information geometry.  Along the way he exposes the reader to Bregman divergences,  cross-entropy,  Legendre dualityItakura-Saito divergence, and Burg matrix divergence.

The Jensen-Shannon divergence is a symmetric version of the Kullback-Leibler divergence.  Unlike the KL-divergence, the square root of the JS-divergence is a true metric obeying the triangle inequality.  Interestingly, if $X$ is a random variable chosen from the average of two distributions $Q$ and $R$, then the J-S divergence between $Q$ and $R$ is equal to the mutual information between $X$ and the indicator function $I$, where $P(I=1) = q(X)/( q(X) + r(X) )$, $q(x)$ is the density of $Q$, and $r(x)$ is the density of $R$.  (One immediate consequence is the JS divergence is always less than 1.)

« Older entries